Service levels
Percus commits to an availability target and publishes the performance it measures. This page states both, and the evidence behind them.
Availability commitment
99.5% monthly availability of the viewer service — the endpoints a recipient's browser calls to load and play a personalised video.
| Measurement | Share of successful requests to the video configuration and player delivery endpoints, evaluated per minute and aggregated monthly. A minute counts as unavailable when more than 5% of its requests fail. |
| Allowed downtime | 3.6 hours per month |
| Exclusions | Announced maintenance with at least 48 hours' notice; failures of upstream providers outside Percus's control; the recipient's own network or browser; usage beyond contracted limits. |
Service credits, if applicable, are defined in the commercial agreement rather than here.
Recovery objectives
| Objective | Commitment |
|---|---|
| RPO — maximum data loss in a recovery scenario | 30 days |
| RTO — maximum time to restore service | 4 hours |
Databases are backed up continuously with point-in-time recovery across a 30-day retention window, so a problem discovered days after it occurred can still be recovered from. Personalisation assets are stored in versioned object storage, and per-viewer data has continuous backup enabled independently of the main database. Production databases are protected against accidental deletion.
Measured performance
These are internal objectives, not contractual commitments. Video loading speed depends partly on the recipient's own network, which Percus does not control and does not measure. We publish what we measure so the numbers can be checked rather than asserted.
Time to first frame
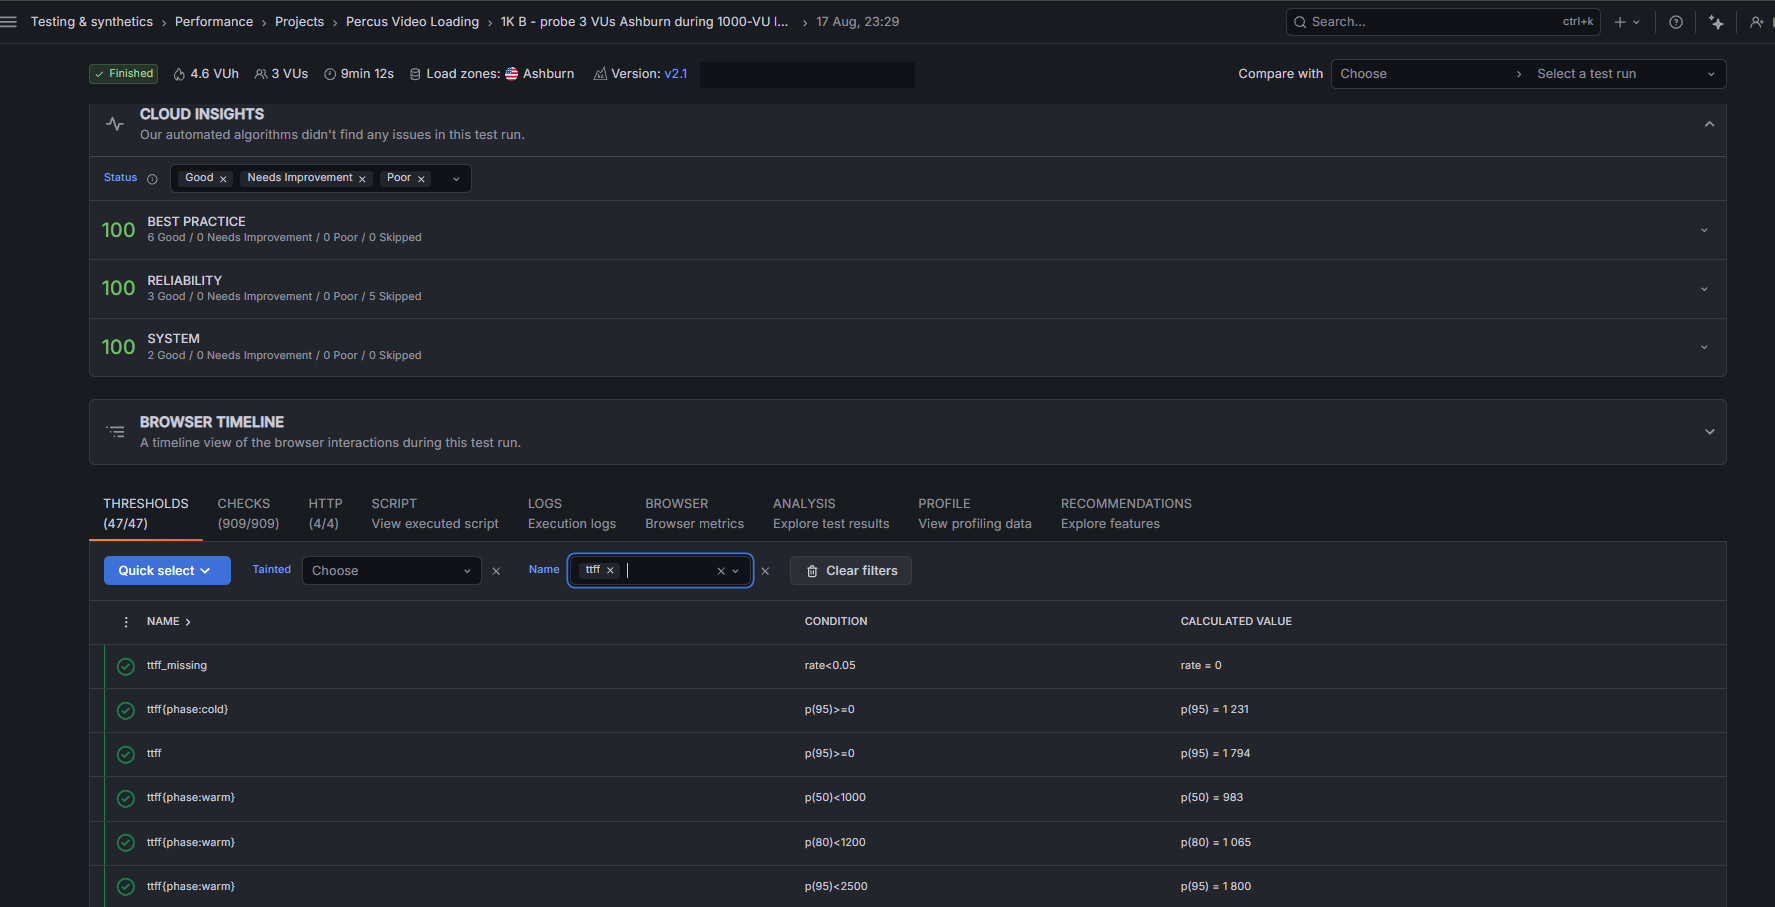
Time from page load to the first frame of the personalised video being painted, measured in real browsers.
| Percentile | Objective | Measured |
|---|---|---|
| p50 | < 1,000 ms | 860–983 ms |
| p80 | < 1,200 ms | 942–1,065 ms |
| p95 | < 2,500 ms | 1,040–1,800 ms |
Platform under load
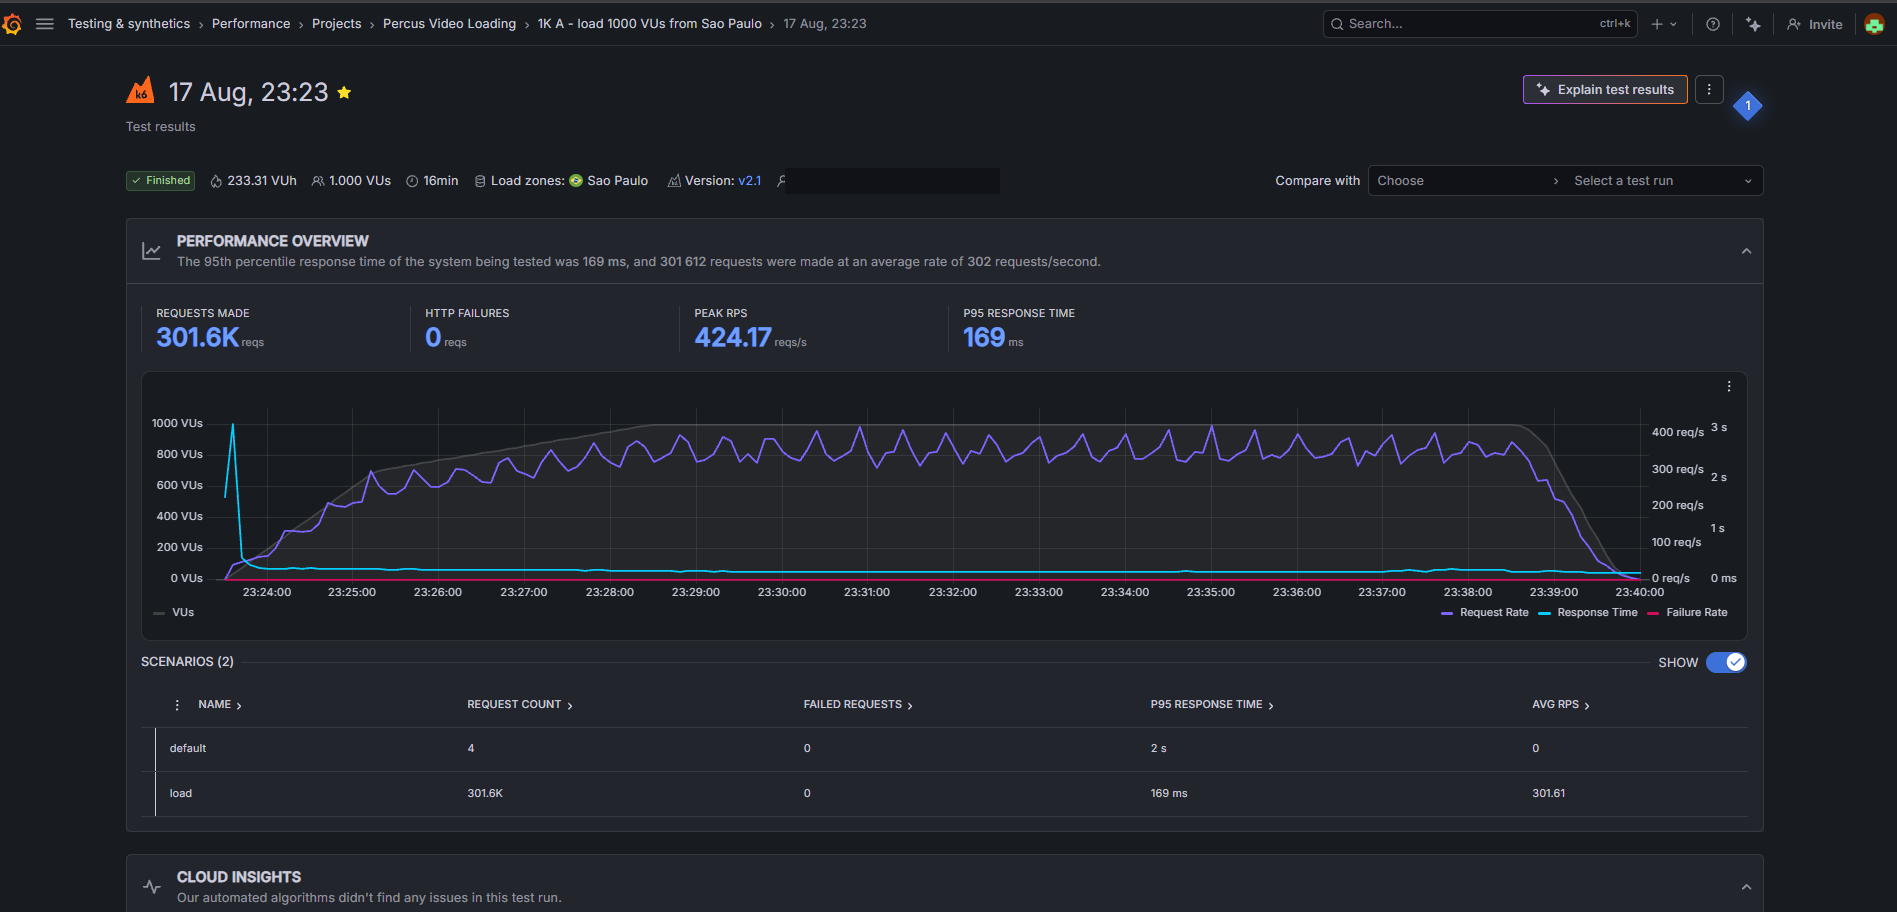
Measured with 1,000 concurrent virtual users generating the full viewer request pattern.
| Measured | |
|---|---|
| Requests served | 301,612 |
| Failed requests | 0 |
| Peak throughput | 424 requests/second |
| API response time (p95) | 169 ms |
Time to first frame did not degrade under load. Measurements taken with no load and with 1,000 concurrent users are within run-to-run variance of each other.
Evidence
Both runs were executed against Grafana Cloud k6 with real browser instrumentation. The load was generated from São Paulo; the browser measurements were taken from a separate region so that the measuring browsers did not compete with the load generators for resources.
Load: 1,000 concurrent virtual users
Time to first frame during that same load
Scope of what has been verified
Stated plainly, because a capacity figure without its boundary is not useful:
- Verified: 1,000 concurrent viewers, with the platform returning zero errors and time to first frame inside the objectives above.
- Not yet verified: the point at which the platform does begin to degrade. Testing has not been ramped beyond 1,000 concurrent viewers, so the ceiling is not yet known.
- Measurements were taken against the staging environment, which runs the same architecture as production.
Higher availability targets require architecture changes that are on the roadmap. This page will be updated when the commitment changes, and the measurements will be re-run rather than carried forward.